This is a group for individuals interested in data visualisation, where members can skill-share, discuss data visualisation topics and highlight great examples.
The current format is an (almost) monthly meeting, either a scheduled speaker, tutorial or a more informal discussion session. “Data visualisation” in this group is focused on representing large scale data in interesting and innovative ways: more than just a graph!
-

3rd June 2024 – Geospatial analysis and the Measles Elimination Strategy
We are pleased to welcome Rich Sanders, Geospatial Consultant at NHS South, Central and West. In this talk, Richard will be describing how the NHS South, Central and West have been developing geospatial solutions to help partners in NHS England address the current outbreak of Measles. Their focus is on looking at the uptake of…
-

6th March 2024 – AR, VR: Augmented Reality for Vector Representations from Deep Learning Models
We are pleased to welcome Alex Davies, a PhD student with the Interactive AI CDT at the University of Bristol. In this talk, Alex will present his work on using new augmented reality hardware to gain real insight into how AI models understand data. Wednesday 6th March, 2-3pmIn-person in seminar room SM4 of the Ada Lovelace Building on…
-

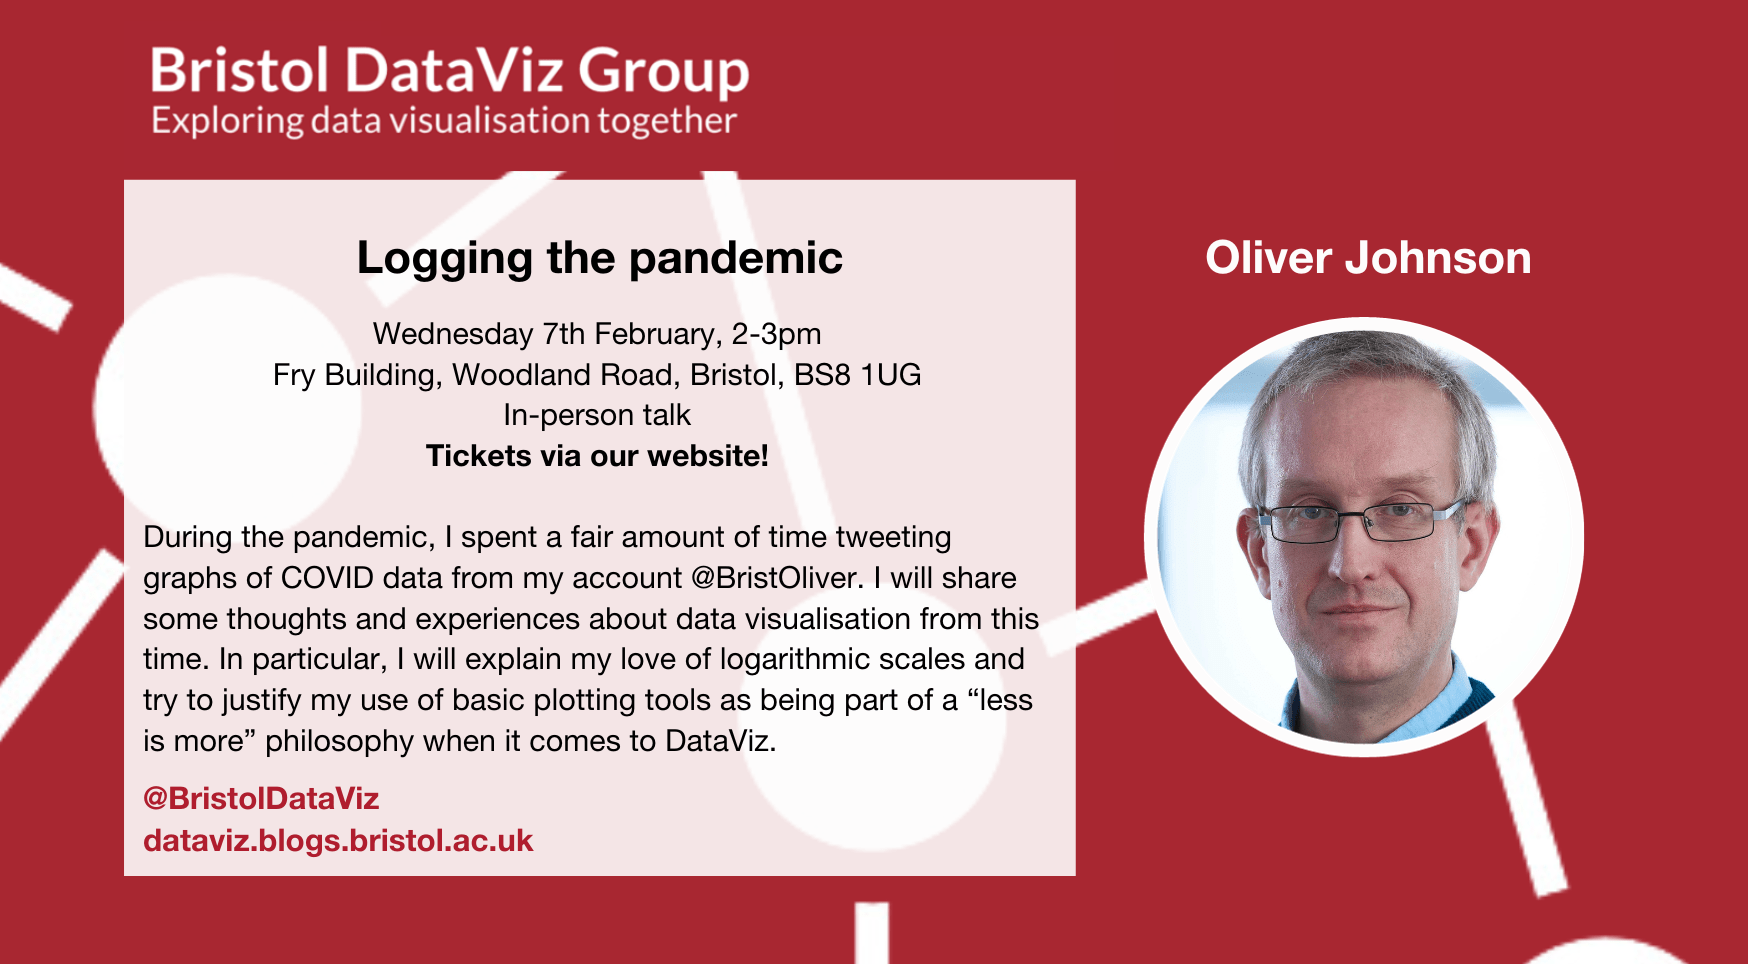
7th February 2024 – Logging the pandemic
During the pandemic, Oliver spent a fair amount of time tweeting graphs of COVID data from his account @BristOliver. In this talk, Oliver will share some thoughts and experiences about data visualisation from this time. In Particular, Oliver will explain his love for logarithmic scales and try to justify his use of basic plotting tools…
