-

3rd June 2024 – Geospatial analysis and the Measles Elimination Strategy
We are pleased to welcome Rich Sanders, Geospatial Consultant at NHS South, Central and West. In this talk, Richard will be describing how the NHS South, Central and West have been developing geospatial solutions to help partners in NHS England address the current outbreak of Measles. Their focus is on looking at the uptake of…
-
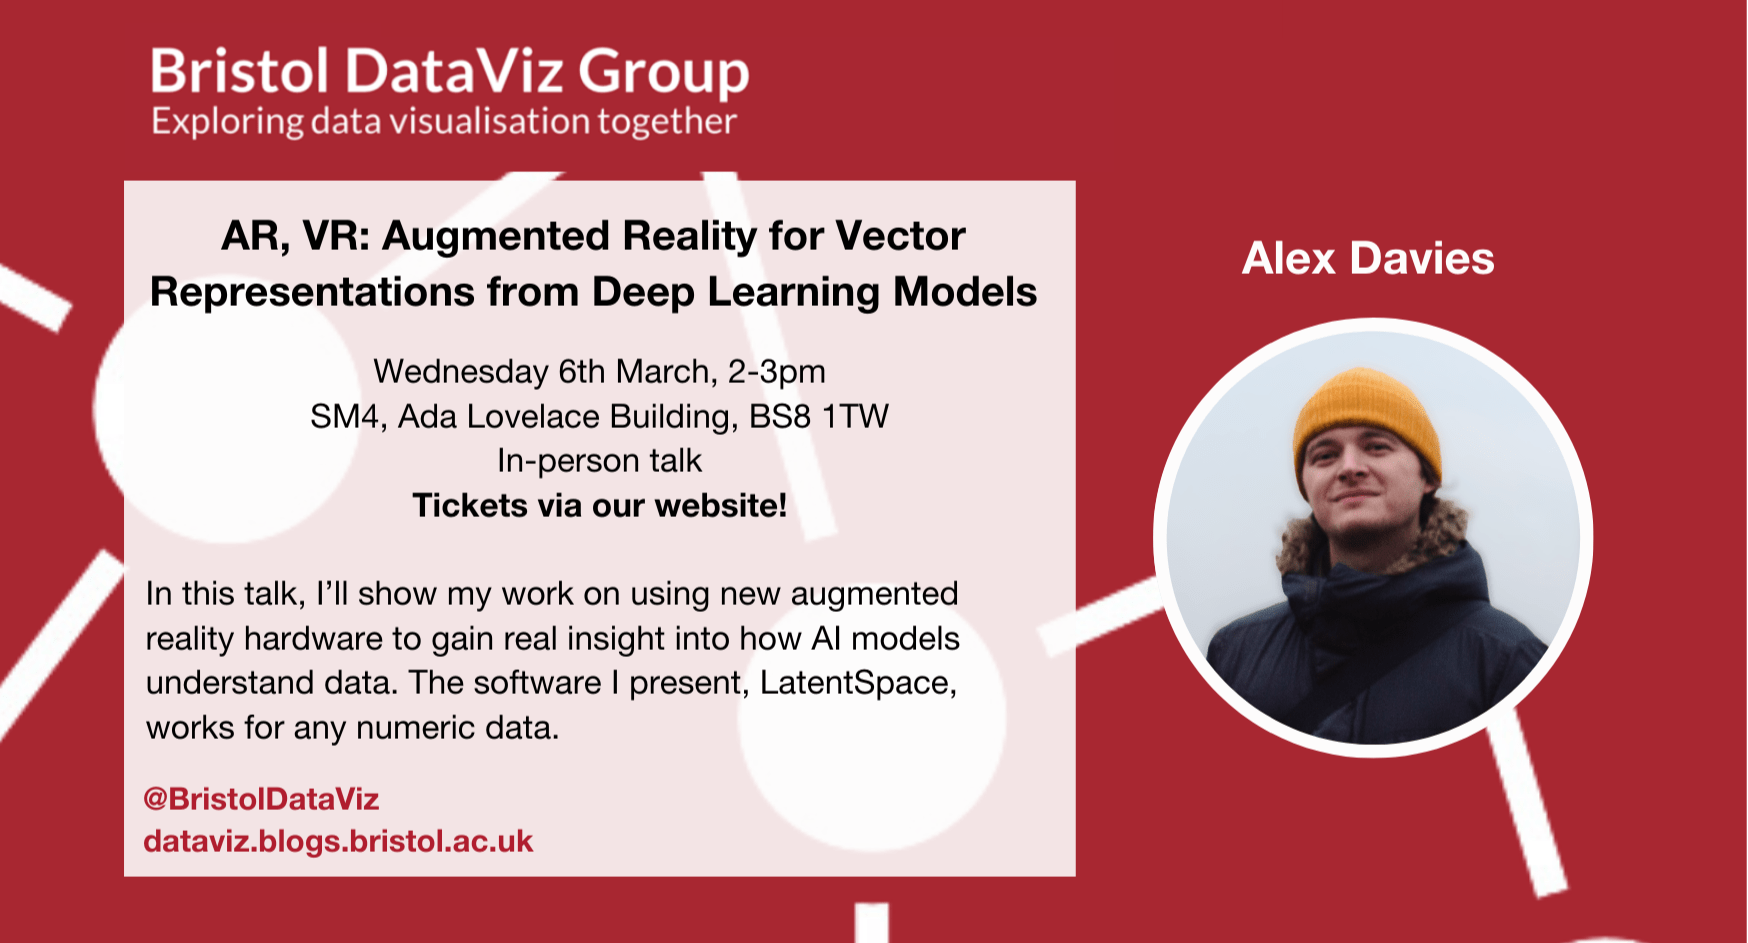
6th March 2024 – AR, VR: Augmented Reality for Vector Representations from Deep Learning Models
We are pleased to welcome Alex Davies, a PhD student with the Interactive AI CDT at the University of Bristol. In this talk, Alex will present his work on using new augmented reality hardware to gain real insight into how AI models understand data. Wednesday 6th March, 2-3pmIn-person in seminar room SM4 of the Ada Lovelace Building on…
-
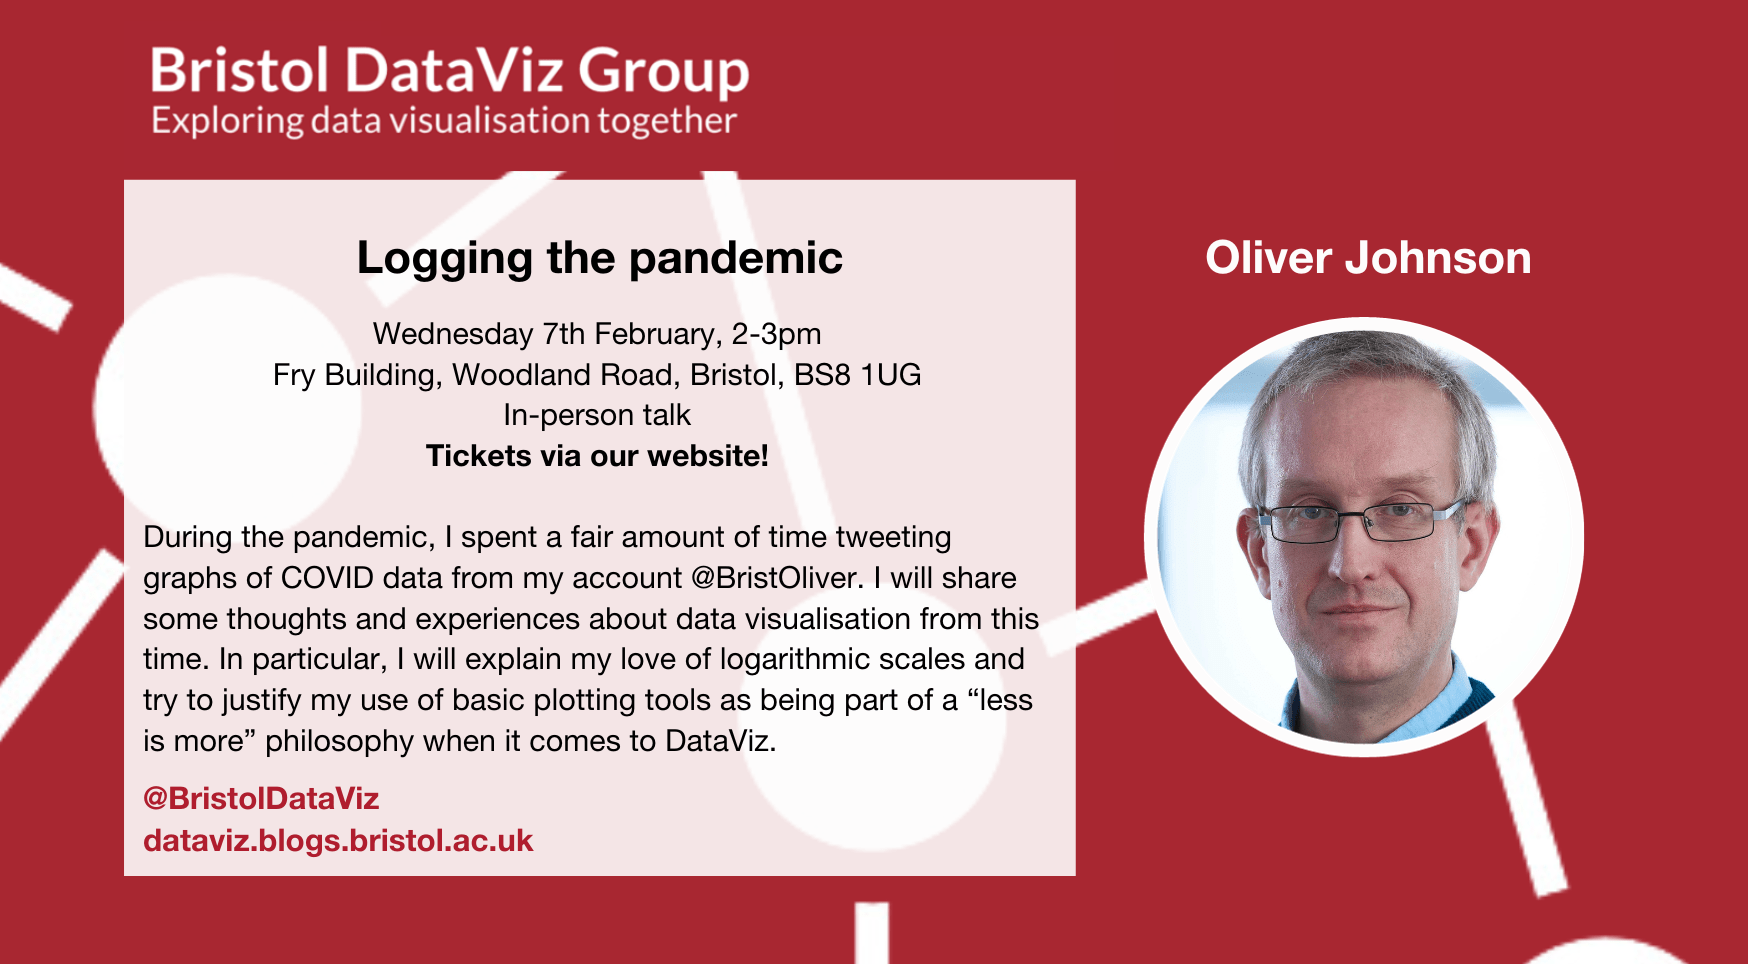
7th February 2024 – Logging the pandemic
During the pandemic, Oliver spent a fair amount of time tweeting graphs of COVID data from his account @BristOliver. In this talk, Oliver will share some thoughts and experiences about data visualisation from this time. In Particular, Oliver will explain his love for logarithmic scales and try to justify his use of basic plotting tools…
-

10th January 2024 – Data visualisation in practise – illustrating functional neuroscience data
In this talk i will discuss some fundamental principles of data visualisation, along with practical tips, with examples from my own PhD research, as well as some examples from other organisations and publications. Wednesday 10th January, 2-3pmIn-person in Room 2.04 of the Fry Building on Woodland Road, Bristol. Oscar Davy I am a data scientist…
-
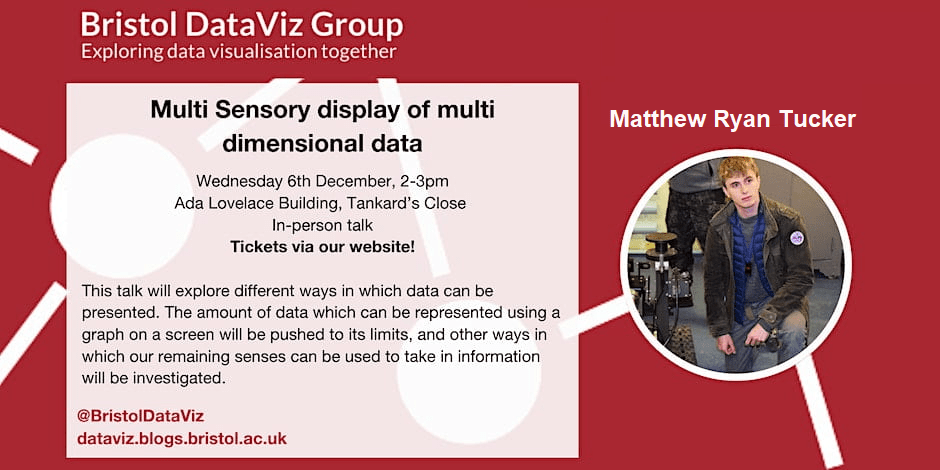
6th December 2023 – Multi Sensory display of multi dimensional data
This talk will explore different ways in which data can be presented. The amount of data which can be represented using a graph on a screen will be pushed to its limits, and other ways in which our remaining senses can be used to take in information will be investigated. Wednesday 6th December, 2-3pmIn-person in…
-
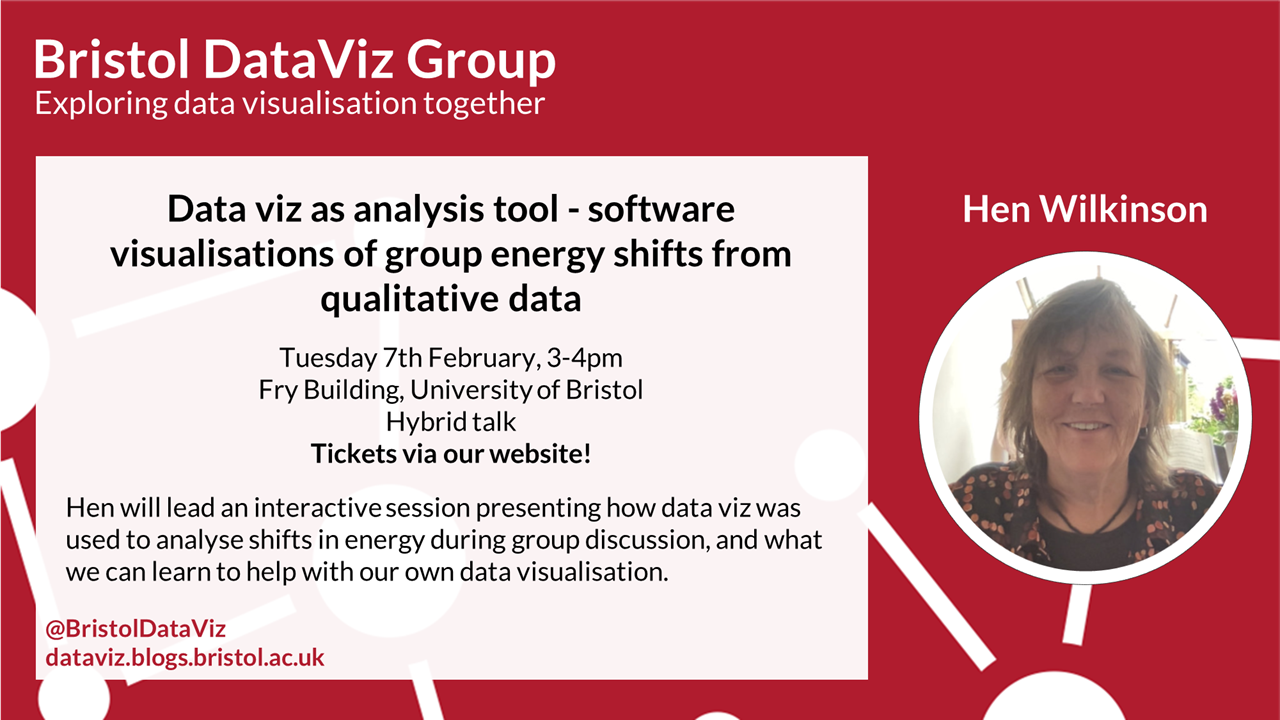
7th February 2023 – Data viz as analysis tool – software visualisations of group energy shifts from qualitative data
In our first session of 2023, we welcome Hen Wilkinson, Research Fellow at the University of Bristol. She will lead an interactive session presenting how data viz was used to analyse shifts in energy during group discussion, and what we can learn to help with our own data visualisation. Tuesday 7th February, 3-4pmRoom G.11, Fry…

Exploring data visualisation together