-
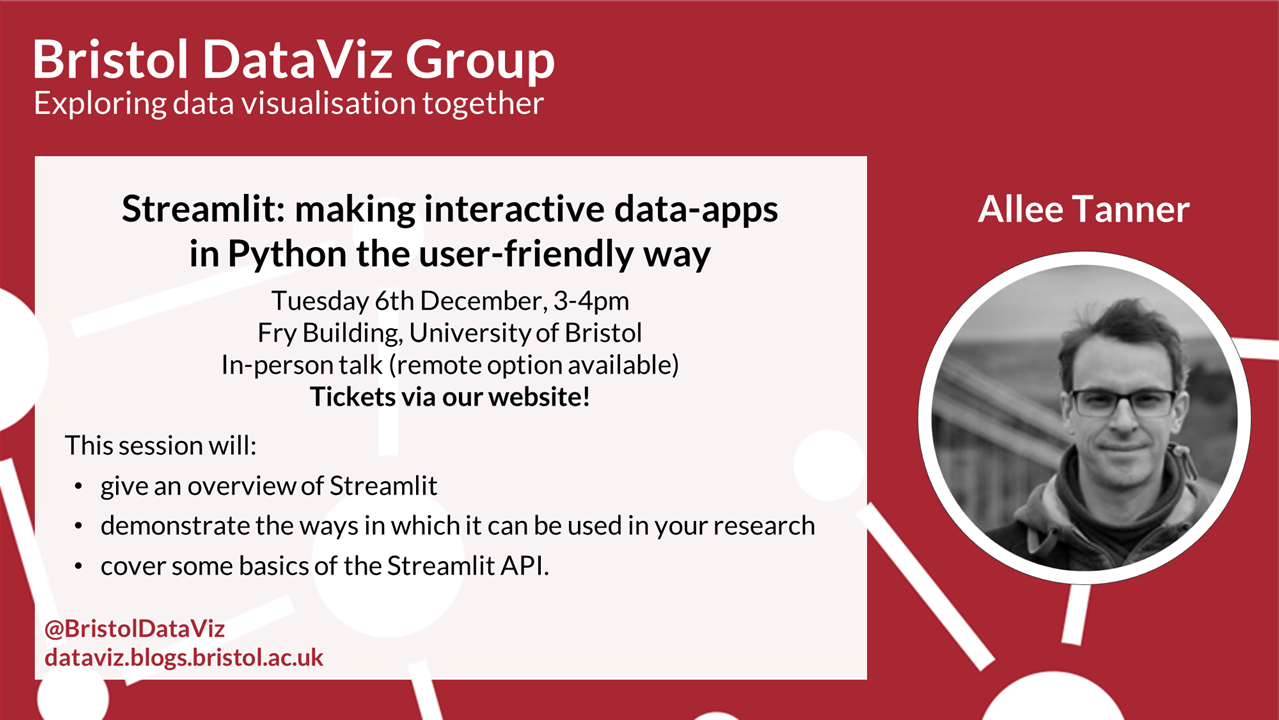
6th December 2022 – Streamlit: making interactive data-apps in Python the user-friendly way
In our next session Allee Tanner from the Jean Golding Institute will introduce us to Streamlit, a Python library that can quickly turn your scripts into web frontends and dashboards.
-
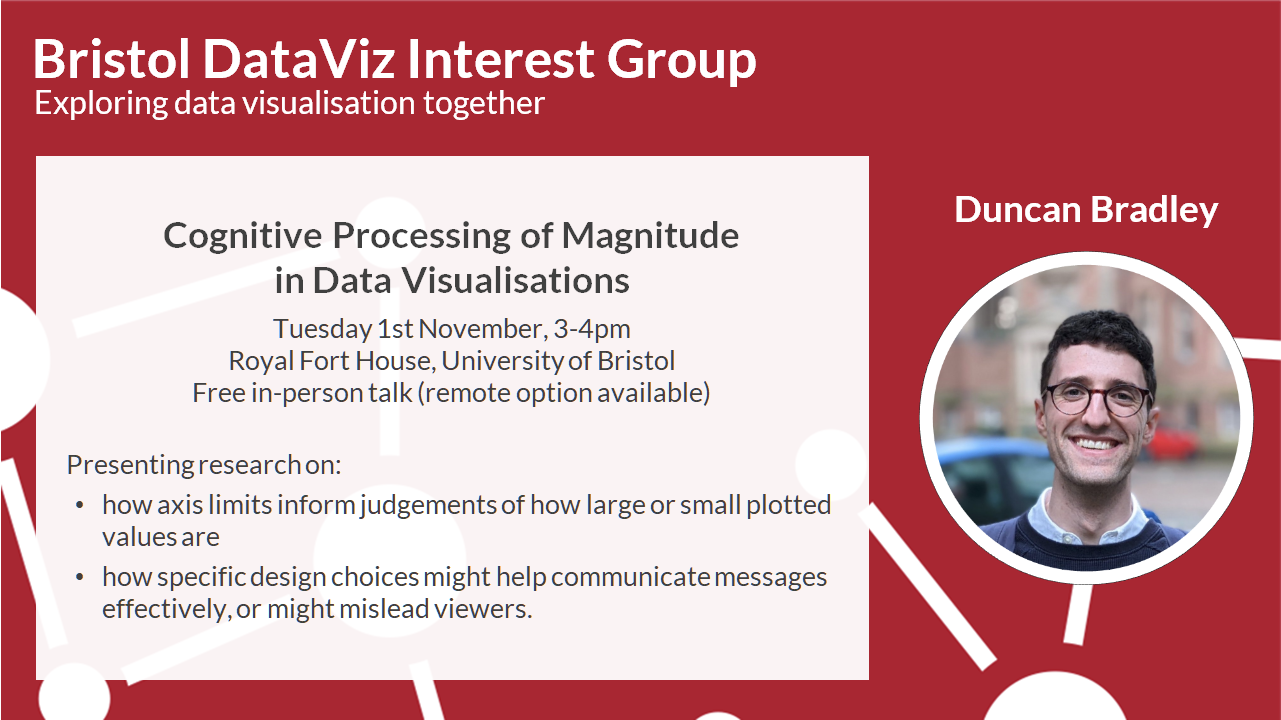
1st November 2022 – Cognitive Processing of Magnitude In Data Visualisations
We’re thrilled to announce a new series of DataViz talks for the start of the 2022/23 academic year! As ever, our events our open to everyone and you do not need to be a member of the University of Bristol. We start with an in-person talk (remote option available) from Duncan Bradley on the Cognitive…
-
15th June 2022 – Digital Arts and Humanities special edition
We’re excited to announce a Digital Arts and Humanities special edition of the DataViz Interest Group being held in-person as part of Bristol Data Week, 12:00–1:30pm at St George’s Bristol. We have four talks illustrating the spectrum of activities in this fast-developing area of research.
-
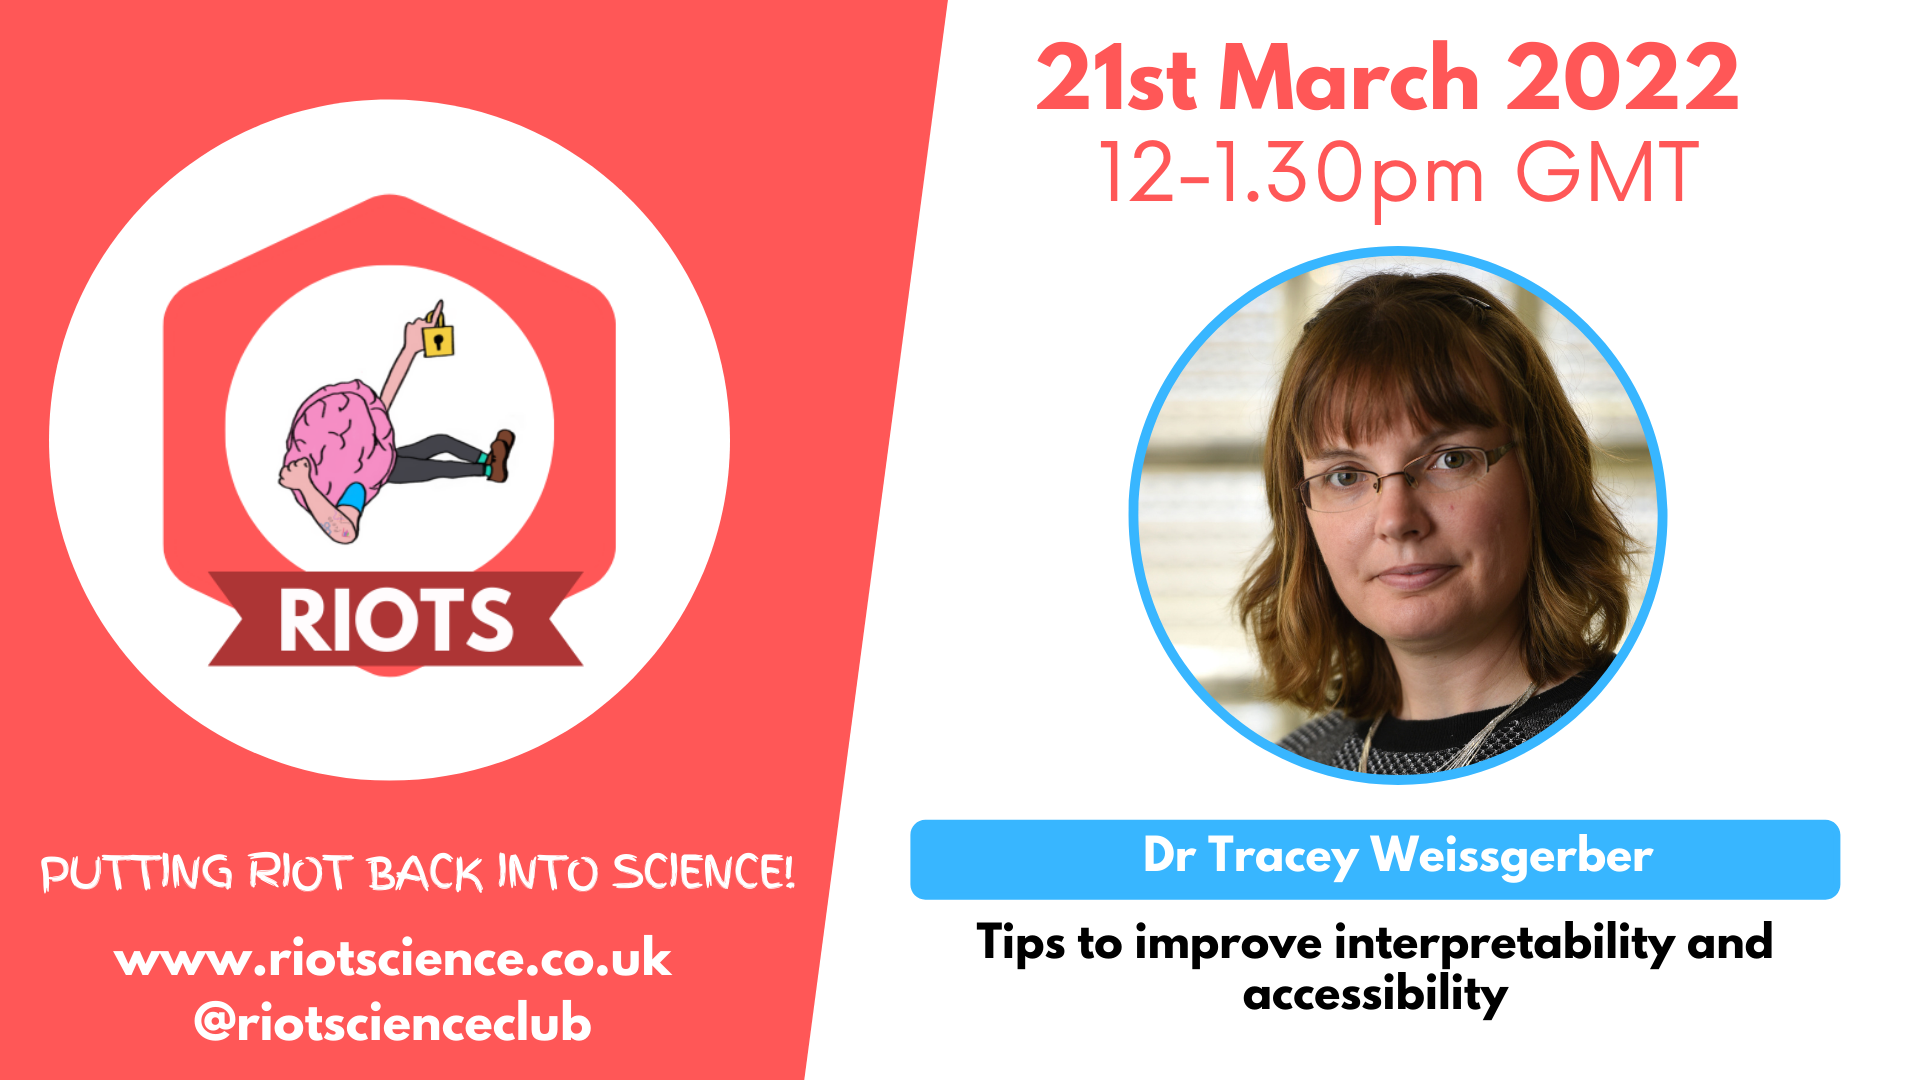
21st March 2022 – Tips to improve interpretability and accessibility
Our friends at RIOT Science Club are hosting an interesting looking talk from Dr Tracey Weissgerber, a meta-researcher at the BIH QUEST Center for Responsible Research (Berlin Institute of Health at Charité).
-
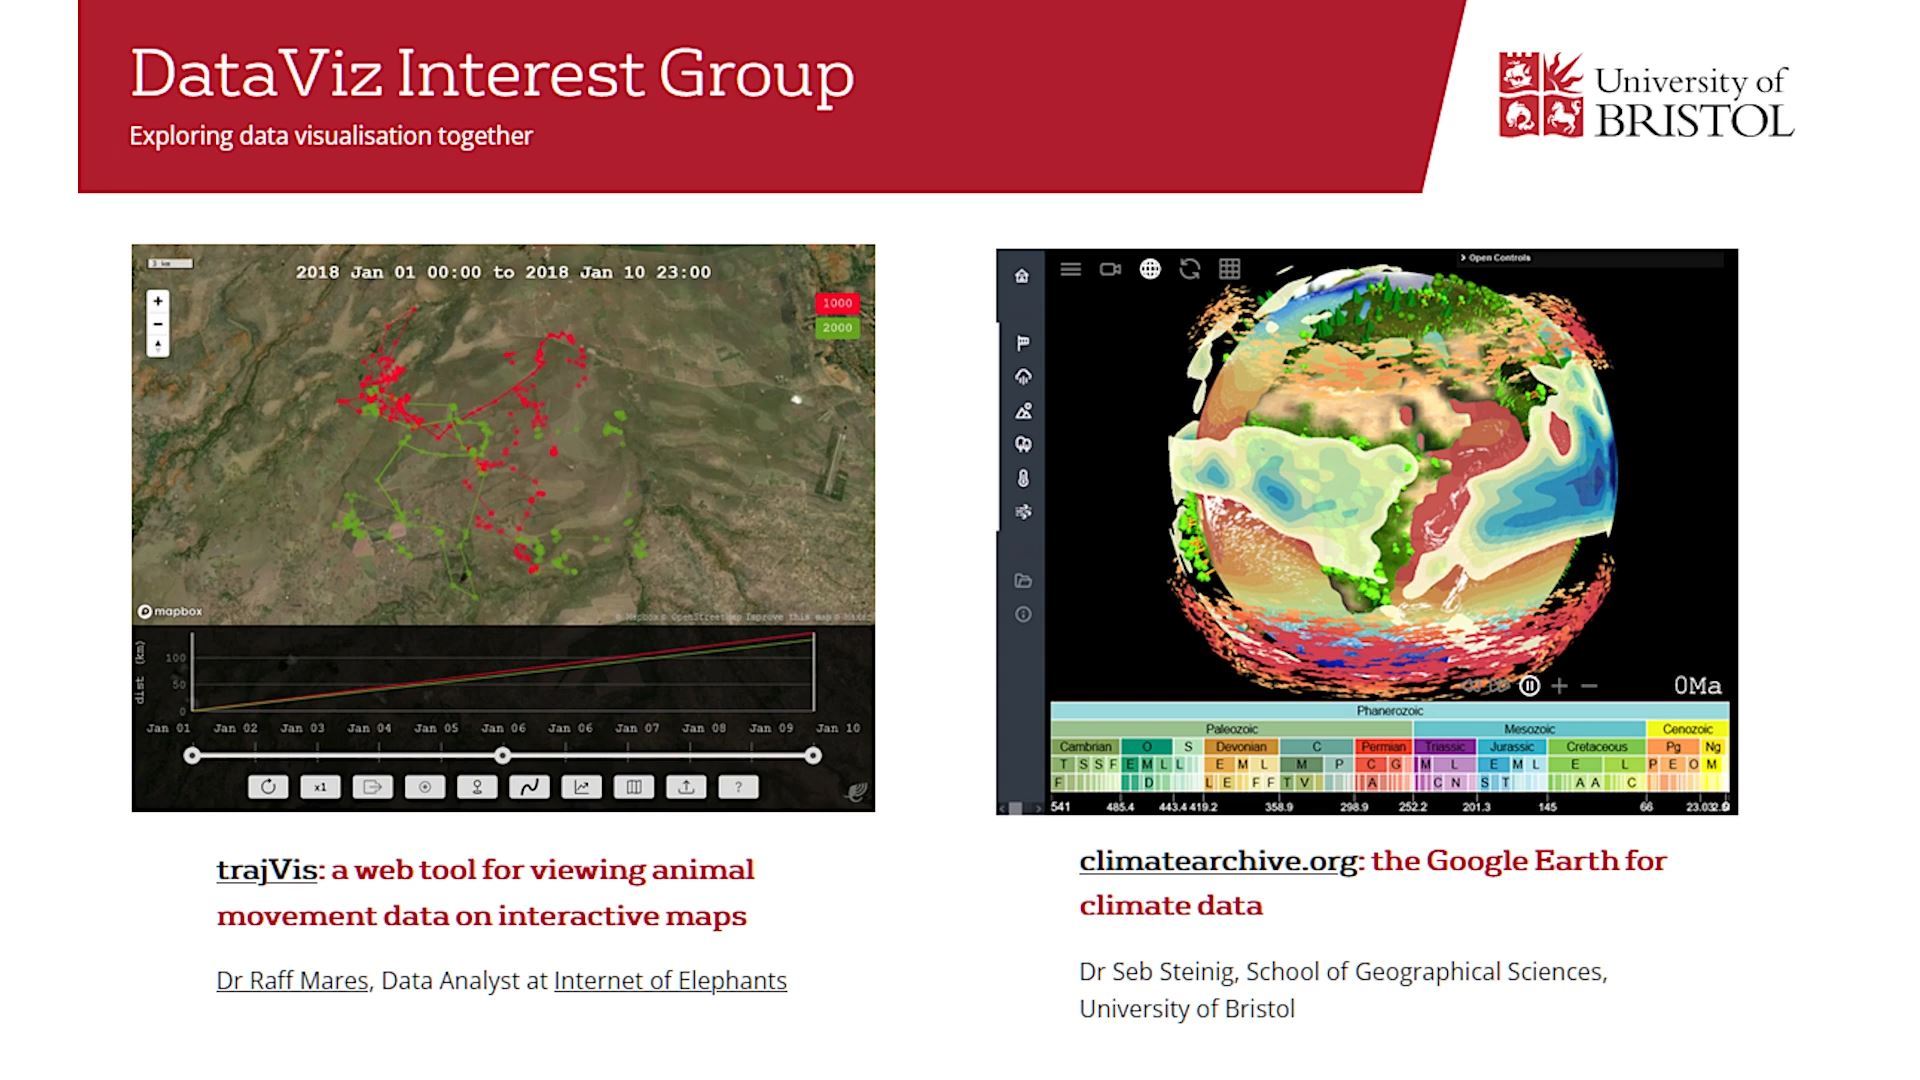
3rd March 2022 – trajVis and climatearchive.org
We’re delighted to have two 20-minute talks from the creators of two awesome web-based data visualisation tools. Raff Mares presents trajVis, a tool for viewing animal movement on interactive maps, and Seb Steinig presents climatearchive.org, a 3D earth model for viewing climate simulations from the extreme past or future (check out the screenshots of both…
-
13th January 2021 – Pie chart or pizza: identifying chart types and their virality on Twitter – Elena Simperl
We have Elena Simperl, a Professor of Computer Science at King’s College London, talking to us in January. See details below. A Zoom link will be sent via the mailing list, or please email the Data Viz Organisers group grp-viz-org@groups.bristol.ac.uk
Bristol DataViz Interest Group
Exploring data visualisation