
We’re delighted to have two 20-minute talks from the creators of two awesome web-based data visualisation tools. Raff Mares presents trajVis, a tool for viewing animal movement on interactive maps, and Seb Steinig presents climatearchive.org, a 3D earth model for viewing climate simulations from the extreme past or future (check out the screenshots of both tools below!)
Thursday 3rd March, 1-2pm
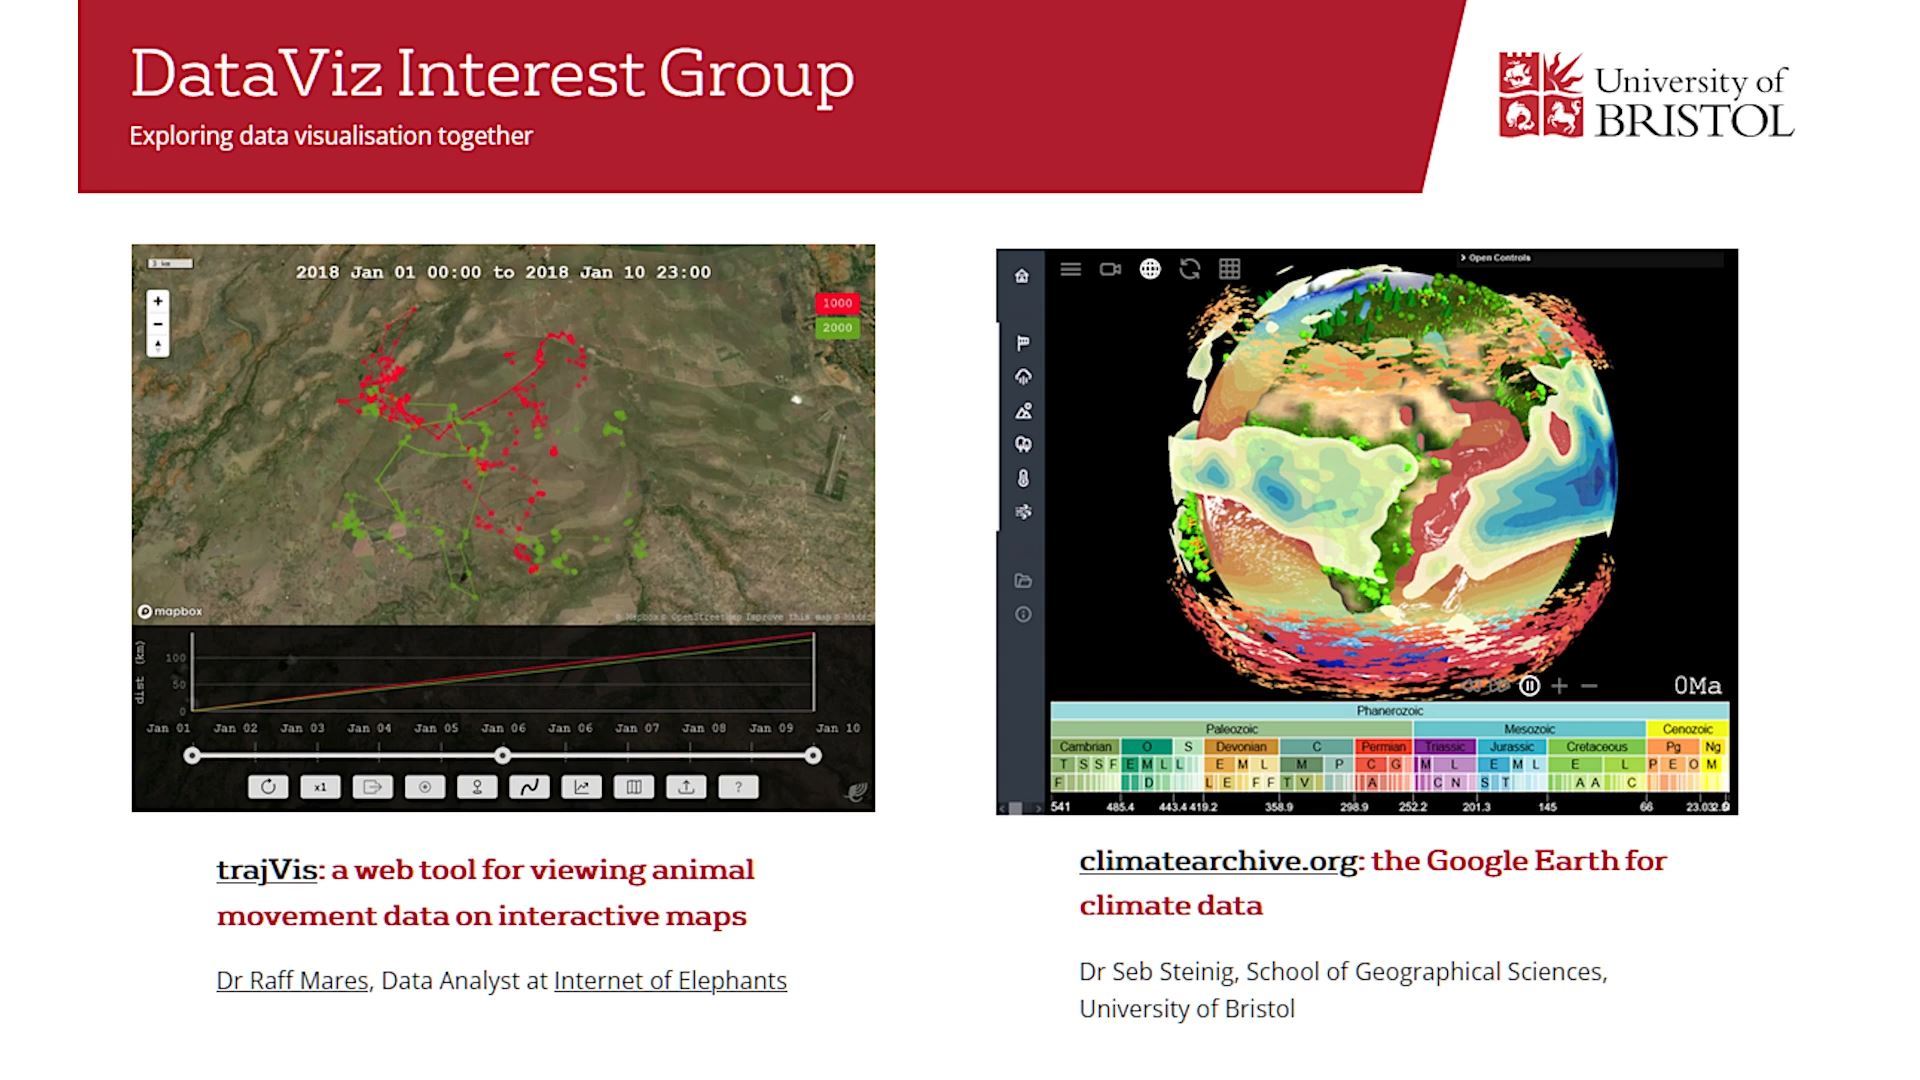
trajVis: a web tool for viewing animal movement data on interactive maps
Dr Raff Mares, Data Analyst at Internet of Elephants

Movement data from wild animals, invaluable for conservation purposes, are increasing in volume as tracking devices become smaller and cheaper. Similarly, the detailed interactive maps that can put these data into context are ubiquitous and super easy to use. Putting the two together, however, isn’t straightforward: there is no tool that lets you easily playback movement data like a video on an interactive map. As the data scientist at Internet of Elephants, a mobile games company that uses wildlife data to tell conservation stories, I needed a quick and efficient way to view and share the amazing animal tracking data we were getting from our conservation partners. I created trajVis, an open-source web tool for visualising trajectory data on interactive maps, to fill this exact need – no installing software, manipulating data or coding required.

Raff is a wildlife biologist and web developer based in Bristol, with an interest in animal movement, spatial data visualisation, and games for conservation. They’ve always been fascinated by how animals move in their environment and have been lucky to study this from ocelots to meerkats, across the rainforest and desert.
climatearchive.org: the Google Earth for climate data
Dr Seb Steinig, School of Geographical Sciences, University of Bristol

We can only fully understand the past, present and future climate changes by bringing together data and process understanding from a broad range of environmental sciences. In theory, climate modelling provides a wealth of data of great interest to a wide variety of disciplines (e.g., chemistry, geology, hydrology), but in practice, the large volume and complexity of these datasets often prevent direct access and therefore limit their benefits for large parts of our community.
We present the new online platform “climatearchive.org” to break down these barriers and provide intuitive and informative access to climate model data to our community and the public. The current release enables interactive access to a compilation of 109 climate model simulations covering the climate evolution of more than 500 million years. Key climate variables (temperature, precipitation, vegetation and circulation) are displayed on a virtual globe in an intuitive three-dimensional environment and on a continuous time axis. The software uses the JavaScript library “Three.js” for real-time GPU-accelerated rendering of complex climate model data. We use this technique to not only explore our Earth, but also the wider solar system and even fantasy worlds like “Dune” and “The Wheel of Time”. “climatearchive.org” runs in any web browser — including smartphones — and promotes data exploration, appeals to students and generates public interest.

Seb is a postdoctoral researcher at the School of Geographical Sciences at the University of Bristol. They are currently using numerical models and paleoclimate data to understand how and why climate has changed in the past. They are particularly interested in how we can share our climate model data and research findings with the wider public.