Announcing our upcoming talks

Bristol DataViz Group Announcing our upcoming talks We’re taking a break this month! We’ll be returning on Wednesday 1st May, 2-3pm in the 2nd Floor Seminar Room (2.04) of the Fry Building And announcing a special edition meeting! During Bristol Data Week (w/c 3rd June). The programme for this event is being finalised and more details will be available soon.

We’re taking a break this month! We’ll be returning on Wednesday 1st May, 2-3pm in-person in the 2nd Floor Seminar Room (2.04) of the Fry Building, School of Mathematics. More details nearer the time.

And announcing a special edition meeting of the Bristol DataViz Group during Bristol Data Week (w/c 3rd June). The programme for this event is being finalised and more details will be available soon.

6th December 2023 – Multi Sensory display of multi dimensional data

This talk will explore different ways in which data can be presented. The amount of data which can be represented using a graph on a screen will be pushed to its limits, and other ways in which our remaining senses can be used to take in information will be investigated.

Wednesday 6th December, 2-3pm
In-person in Room SM4 of the Ada Lovelace Building on Tankard’s Close, Bristol.

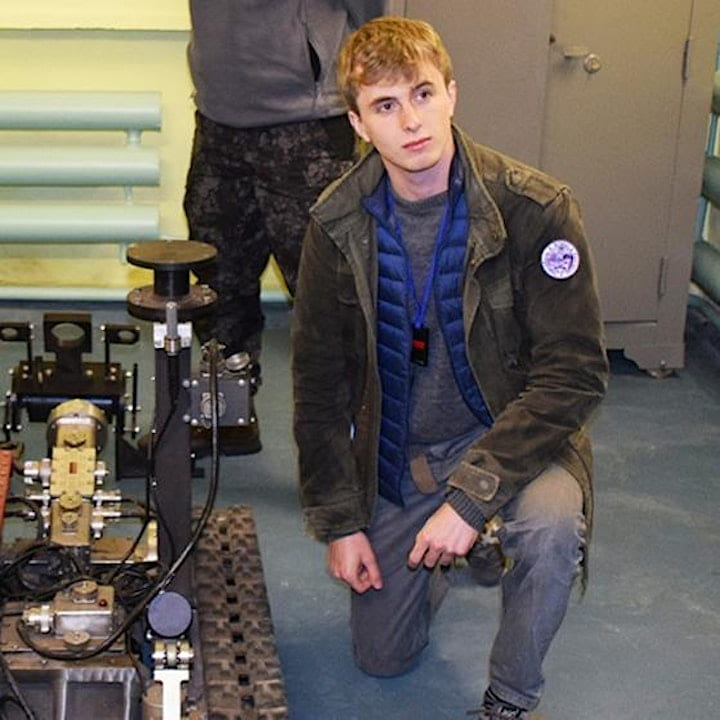
Matthew Ryan Tucker
Matthew undertook his Physics PhD at the University of Bristol, developing techniques for the mapping of radiation and processing of data gathered by sensor systems and quadrupedal robots. He is now working at the Department for Energy Security and Net Zero as an energy engineer, using computer models to help inform energy policy decisions

7th February 2023 – Data viz as analysis tool – software visualisations of group energy shifts from qualitative data

In our first session of 2023, we welcome Hen Wilkinson, Research Fellow at the University of Bristol. She will lead an interactive session presenting how data viz was used to analyse shifts in energy during group discussion, and what we can learn to help with our own data visualisation.

Data viz as analysis tool - software visualisations of group energy shifts from qualitative data. Tuesday 7th February, 3-4pm, Fry Building, University of Bristol. Hybrid talk. Tickets via our website! Hen will lead an interactive session presenting how data viz was used to analyse shifts in energy during group discussion, and what we can learn to help with our own data visualisation.

Tuesday 7th February, 3-4pm
Room G.11, Fry Building, Woodland Road, University of Bristol (view map)
Hybrid talk – Hen will be joining us remotely but we encourage you to join us in-person if you can

This talk presents an early-stage methodology for which emerged from empirical PhD research at the University of Bristol. The visualisations resulted from a transdisciplinary team of social scientist, data scientist and graphic design and formed part of the analysis process rather than simply presenting results. This talk presents the outputs and discusses the research into design/aesthetics that lies behind the final visualisation.

Hen Wilkinson

Since training as an accredited mediator in the 1990s, Hen has been working on how to creatively engage with conflict, difference and divide within teams, organisations and local communities. In 2001, this led to the formation of Community Resolve, and 15 years later she was funded by the UK’s Economic and Social Research Council to review and reflect on that work. Her funded PhD was followed by ESRC postdoc funding as a senior research associate at the JGI. Hen currently holds a Researcher-in-Residence post with REPHRAIN (a national hub for addressing online harms) and works on the emerging field of peacetech as a Research Fellow at the JGI.

6th December 2022 – Streamlit: making interactive data-apps in Python the user-friendly way

In our next session Allee Tanner from the Jean Golding Institute will introduce us to Streamlit, a Python library that can quickly turn your scripts into web frontends and dashboards.

Tuesday 6th December, 3-4pm
Room G.11, Fry Building, Woodland Road, University of Bristol (view map)
In-person talk (remote option available)

Streamlit is a Python library for rapid prototyping, templating and deploying data-science dashboards and web-apps (a desktop-app option is also in development). A core goal is simplicity, allowing even beginners to create data-apps within minutes, harnessing powerful graphical packages while avoiding the complexity these often entail. Python remains at the forefront of research coding languages, being relatively easy to learn, having a wide selection of professionally-developed 3rd-party libraries, all supported by a dynamic, responsive community.

Good research relies on clear communication. The power of Streamlit is in providing an accessible way for us to share the messages emerging from underlying, complex work. While graphics libraries to visualise analyses exist, most notably in JavaScript, often these require considerable coding expertise, or may be inflexible in their application. With intelligent API design – as Streamlit characterises – these complexities can be managed, renewing focus on the research message.

This session aims to give an overview of Streamlit, demonstrate the ways in which it can be used in research, and cover some basics of the Streamlit API. We hope the session will encourage researchers to explore how Streamlit might be used in their work.

Allee Tanner

Allee Tanner is a research software engineer with the Jean Golding Institute for Data Science (JGI). Allee’s research background is in earth sciences biosciences, leading to a PhD in evolutionary genomics with a scholarship in teaching. After completing his PhD, Allee dabbled in a post-doc with the medical school, before joining the RSE team in 2019. Since then, his research projects have included epidemiology, physics and environmental mineralogy, and he teaches coding and research skills as a member of the Advanced Computing Research Centre.

1st November 2022 – Cognitive Processing of Magnitude In Data Visualisations

We’re thrilled to announce a new series of DataViz talks for the start of the 2022/23 academic year! As ever, our events our open to everyone and you do not need to be a member of the University of Bristol.

We start with an in-person talk (remote option available) from Duncan Bradley @duncanbradley_ on the Cognitive Processing of Magnitude In Data Visualisations.

A talk from the Bristol DataViz Interest Group, exploring data visualisation together Cognitive Processing of Magnitude In Data Visualisations by Duncan Bradley Tuesday 1st November, 3-4pm Royal Fort House, University of Bristol Free in-person talk (remote option available) Presenting research on: how axis limits inform judgements of how large or small plotted values are how specific design choices might help communicate messages effectively, or might mislead viewers.

Tuesday 1st November, 3-4pm
Royal Fort House, University of Bristol

In-person talk (remote option available)

Data visualisations allow viewers to efficiently appraise many facets of a dataset. Systematically manipulating data visualisation designs helps us understand the processes involved in interpreting presented information. In this seminar, I will discuss a series of experiments revealing how axis limits inform judgements of how large or small plotted values are. These findings contribute to our understanding of the cognitive processing of magnitude in data visualisations, with potential consequences for design recommendations. This work provides insight into how specific design choices might help communicate messages effectively, or might mislead viewers.

Duncan Bradley

Duncan Bradley is a final-year PhD student in the Division of Neuroscience at the University of Manchester. He is interested in how data visualisations can leverage the human cognitive system to effectively convey messages. His research explores the cognitive processes involved in extracting meaning from data visualisations and the influence of design choices on the interpretation of presented information.