3rd June 2024 – Geospatial analysis and the Measles Elimination Strategy

We are pleased to welcome Rich Sanders, Geospatial Consultant at NHS South, Central and West. In this talk, Richard will be describing how the NHS South, Central and West have been developing geospatial solutions to help partners in NHS England address the current outbreak of Measles. Their focus is on looking at the uptake of MMR (Measles, Mumps and Rubella) vaccination uptake and trying to find patterns of low uptake, especially when they’re related to health inequalities and social deprivation.

Monday 3rd June, 12-1pm
Online (Zoom) as part of Bristol Data Week 2024
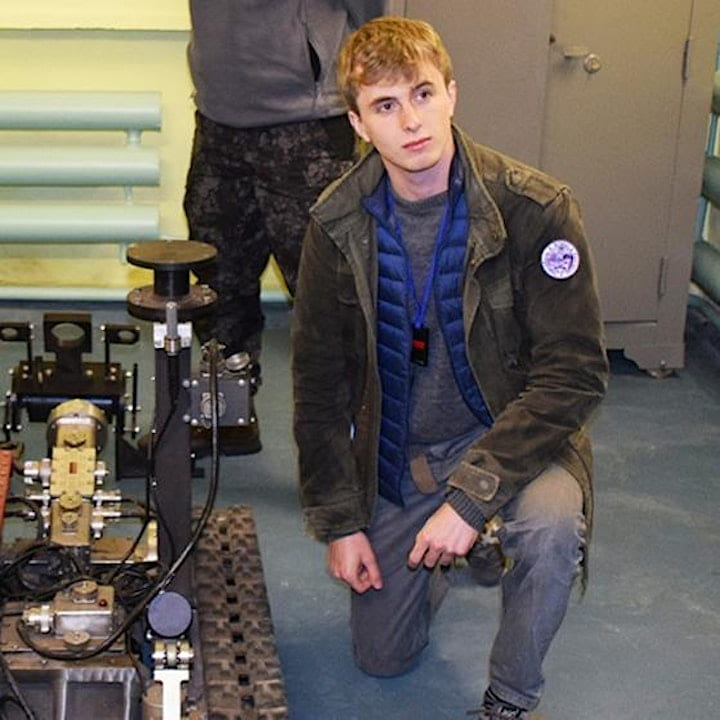
Rich Sanders

Rich Sanders
Rich is a Geospatial Consultant, and joined SCW in 2016. He has a BSc in Biological Sciences and MSc in Applied GIS from University of the West of England. He previously spent 13 years working in GIS at Sustrans, a sustainable travel charity, planning and maintaining cycle routes and producing maps, statistics and graphics. He has also worked for Public Health England and in the pharmaceutical industry. His skills include; mapping and analysis and cartography. Family life is keeping Rich busy at the moment, but in his spare time he loves to ride and maintain bikes.

Bristol Data Week 2024

This event is part of Bristol Data Week 2024, organised by the Jean Golding Institute. Running from Monday 3rd June – Friday 7th June 2024, this will be our 7th annual Data Week; an interactive programme of speakers, training and workshops open to all and completely free of charge.

Keep up to date with sessions happening throughout Bristol Data Week on the Jean Golding Institute website follow us on Twitter @JGIBristol and use #BristolDataWeek.

6th March 2024 – AR, VR: Augmented Reality for Vector Representations from Deep Learning Models

We are pleased to welcome Alex Davies, a PhD student with the Interactive AI CDT at the University of Bristol. In this talk, Alex will present his work on using new augmented reality hardware to gain real insight into how AI models understand data.

Wednesday 6th March, 2-3pm
In-person in seminar room SM4 of the Ada Lovelace Building on Tankard’s CloseBristol.

If you’re interested, please sign-up to our mailing list to book your free ticket and to be notified of any new updates & reminders about this event.

Alex Davies
Alex is a PhD student with the Interactive AI CDT at the University of Bristol. His work mainly focusses on using AI for graph data, meaning molecules, social networks, road networks, proteins, and anything else where you can draw a line between two points.

7th February 2024 – Logging the pandemic

During the pandemic, Oliver spent a fair amount of time tweeting graphs of COVID data from his account @BristOliver. In this talk, Oliver will share some thoughts and experiences about data visualisation from this time. In Particular, Oliver will explain his love for logarithmic scales and try to justify his use of basic plotting tools as being part of a “less is more” philosophy when it comes to DataViz.

Wednesday 7th February, 2-3pm
In-person in Room 2.04 of the Fry Building on Woodland Road, Bristol.

Oliver Johnson
Oliver Johnson is Director of the Institute of Statistical Science in the School of Mathematics. During the COVID pandemic he provided commentary and graphical representations from a mathematical point of view. His book Numbercrunch (Heligo Books, 2023) is written for a general audience and describes the value of maths as a tool for making sense of the world.

10th January 2024 – Data visualisation in practise – illustrating functional neuroscience data

In this talk i will discuss some fundamental principles of data visualisation, along with practical tips, with examples from my own PhD research, as well as some examples from other organisations and publications.

Wednesday 10th January, 2-3pm
In-person in Room 2.04 of the Fry Building on Woodland Road, Bristol.

Oscar Davy
I am a data scientist at a tech consultancy company, with a PhD in computational Neuroscience (Neural Dynamics programme, Bristol University). Whilst the academic life was not for me, I always greatly enjoyed the challenge of not only generating insights from complex and messy datasets, but also how to effectively communicate these insights to audiences who may be non-specialists, unfamiliar with the specifics, or just tired and slightly bored at the end of a long meeting/conference.

6th December 2023 – Multi Sensory display of multi dimensional data

This talk will explore different ways in which data can be presented. The amount of data which can be represented using a graph on a screen will be pushed to its limits, and other ways in which our remaining senses can be used to take in information will be investigated.

Wednesday 6th December, 2-3pm
In-person in Room SM4 of the Ada Lovelace Building on Tankard’s Close, Bristol.

Matthew Ryan Tucker
Matthew undertook his Physics PhD at the University of Bristol, developing techniques for the mapping of radiation and processing of data gathered by sensor systems and quadrupedal robots. He is now working at the Department for Energy Security and Net Zero as an energy engineer, using computer models to help inform energy policy decisions